
25.2 Prometheus 监控部署
Prometheus 是一款开源的时间序列监控系统和警报工具包,可实时记录纯数字的时序数据,并提供性能监控和告警功能。以 Prometheus TSDB 为时序数据库,通过 exporters 采集节点系统负载、存储与内存指标,并部署 Alertmanager 实现告警通知。
25.2.1 框架
Prometheus 监控部署框架如图所示。
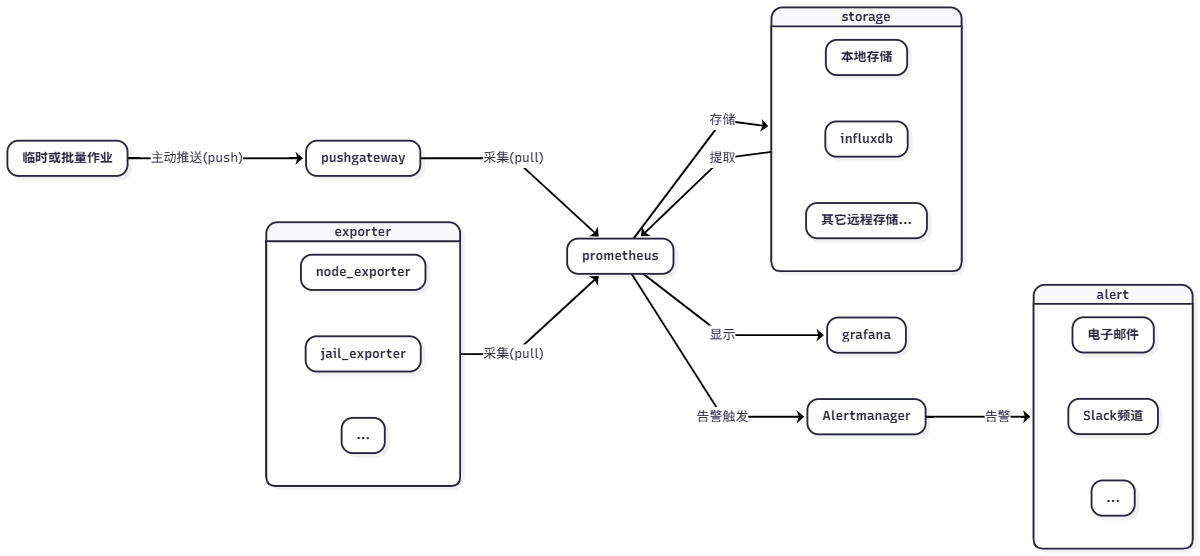
说明:
- Prometheus 是整个监控系统的中心。
- Grafana 将监控数据可视化显示。
- Exporter 负责数据采集。Prometheus 支持多种 Exporter,可使用
pkg search -D prometheus查找。 - Alertmanager 负责处理告警信息。
- Prometheus 可配置多种远程存储。
注意
Prometheus、Grafana、Exporter、Alertmanager 等组件可以分别部署在不同的设备或操作系统上。Exporter 应安装在被监控的节点上。以下示例中,Prometheus、Grafana、Alertmanager 安装在同一台机器上,Exporter 根据需要单独部署。
如遇服务启动问题,可查看 /var/log/daemon.log 文件。Prometheus 配置文件大部分采用 YAML 格式,请注意缩进。对于 Prometheus 配置文件,可使用 promtool check 命令检查配置文件是否正确。
25.2.2 安装基本工具
了解框架后,需安装 Prometheus 监控系统的基本组件。
25.2.2.1 安装 prometheus
使用 pkg 包管理器安装:
# pkg install prometheus或者使用 Ports 方式安装:
# cd /usr/ports/net-mgmt/prometheus2/
# make install clean25.2.2.1.1 服务项
设置 Prometheus 服务开机自启并启动服务:
# service prometheus enable   # 将 Prometheus 服务加入系统启动项
# service prometheus start # 启动 Prometheus 服务25.2.2.2 安装 Grafana
使用 pkg 包管理器安装:
# pkg install grafana或者使用 Ports 方式安装:
# cd /usr/ports/www/grafana/
# make install clean25.2.2.2.1 服务项
设置 Grafana 服务开机自启并启动服务:
# service grafana enable   # 将 Grafana 服务加入系统启动项
# service grafana start # 启动 Grafana 服务25.2.2.3 安装 node_exporter
使用 pkg 包管理器安装:
# pkg install node_exporter或者使用 Ports 方式安装:
# cd /usr/ports/sysutils/node_exporter
# make install clean25.2.2.3.1 服务项
设置 Node Exporter 服务开机自启并启动服务:
# service node_exporter enable   # 将 Node Exporter 服务加入系统启动项
# service node_exporter start # 启动 Node Exporter 服务25.2.3 配置
目录结构:
/
├── usr
│   └── local
│       └── etc
│           ├── prometheus.yml                 # Prometheus 主配置文件
│           ├── prometheus_webconfig.yml       # Prometheus Web 认证配置文件
│           ├── node_exporter_webconfig.yml    # Node Exporter Web 认证配置文件
│           └── prometheus
│               └── alert.rules.yml           # Prometheus 告警规则文件
└── var
    └── log
└── daemon.log # 系统守护进程日志25.2.3.1 Prometheus
Prometheus 的主要配置文件为 /usr/local/etc/prometheus.yml,内容如下:
scrape_configs:
  # The job name is added as a label job=<job_name> to any timeseries scraped from this config.
  - job_name: "prometheus"

    # metrics_path defaults to '/metrics'
    # scheme defaults to 'http'.

    static_configs:
- targets: ["localhost:9090"]scrape_configs 配置采集数据的目标节点,这里默认的 targets: ["localhost:9090"] 指 Prometheus 服务本身。
现在增加监控主机信息的 node_exporter,在 scrape_configs 下写入如下:
scrape_configs:
  # The job name is added as a label job=<job_name> to any timeseries scraped from this config.
  - job_name: "prometheus"

    # metrics_path defaults to '/metrics'
    # scheme defaults to 'http'.

    static_configs:
      - targets: ["localhost:9090"]

  - job_name: "node_exporter_local"
    static_configs:
- targets: ["localhost:9100"]重启 Prometheus。
# service prometheus restart由此向 Prometheus 增加了一个新的监控节点,任务名为 node_exporter_local。[] 中可添加多个主机。
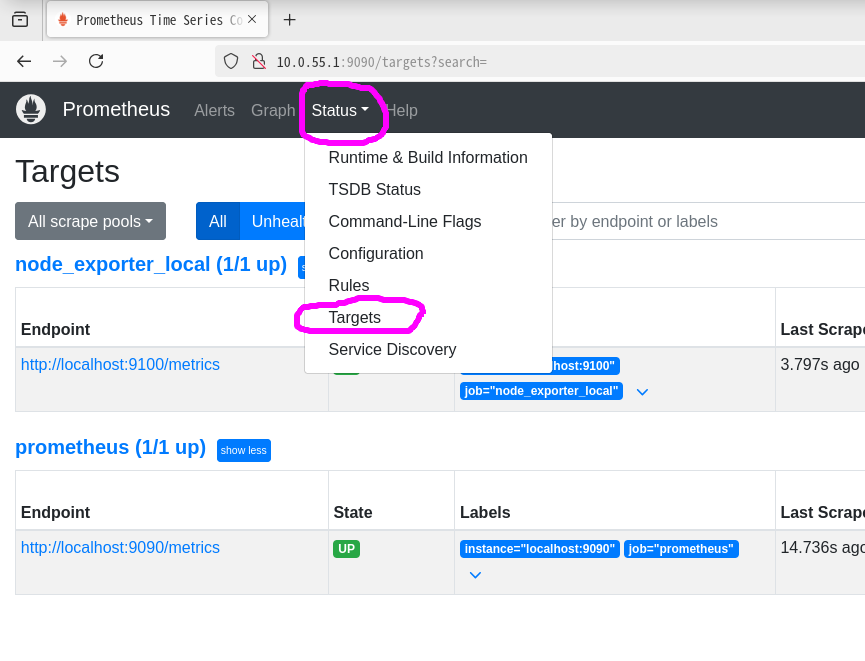
Prometheus 提供 Web 界面(默认端口 9090),可查看如下监控目标信息:
Graph 页面:可查看各项监控指标,支持表达式。
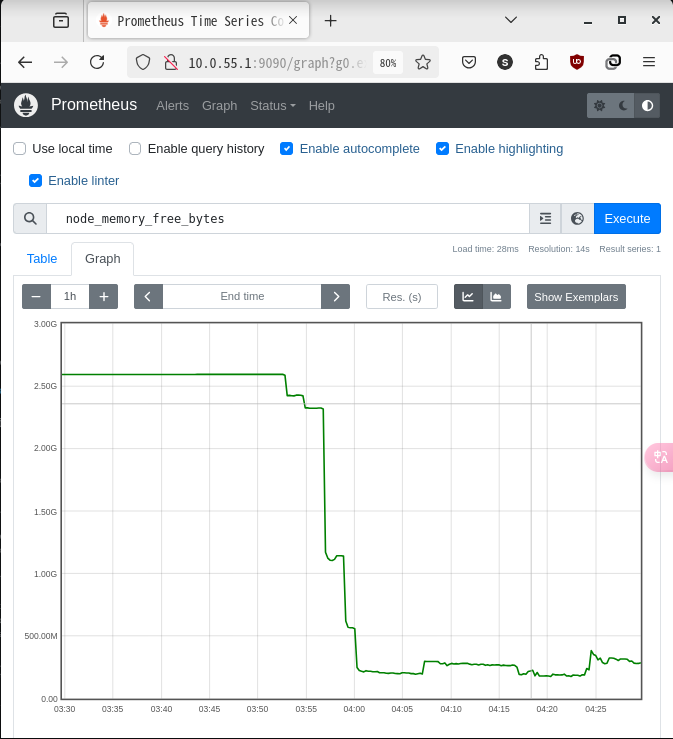
直接查看数据或 Panel 不够便捷,可使用 Grafana 更直观地展示数据。
25.2.3.2 Grafana
在浏览器中打开 Grafana 的 Web 页面(默认端口为 3000),默认用户名为 admin,密码为 admin。
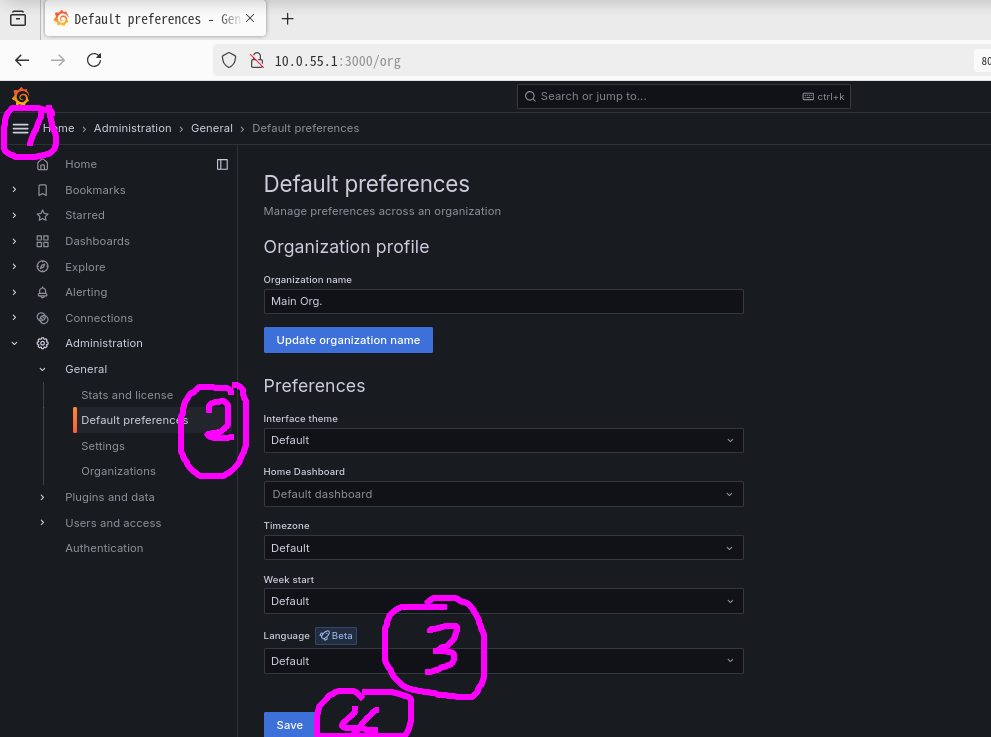
如下图所示,可切换为中文界面:
先创建与 Prometheus 的数据源连接。
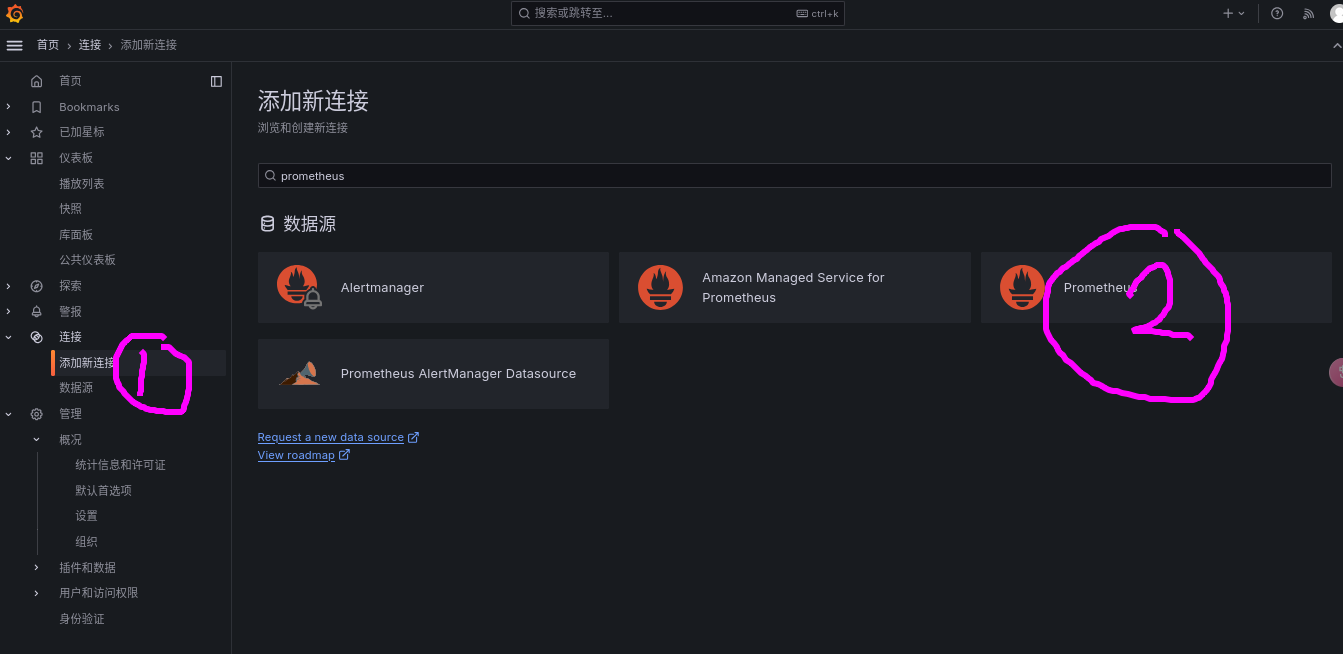
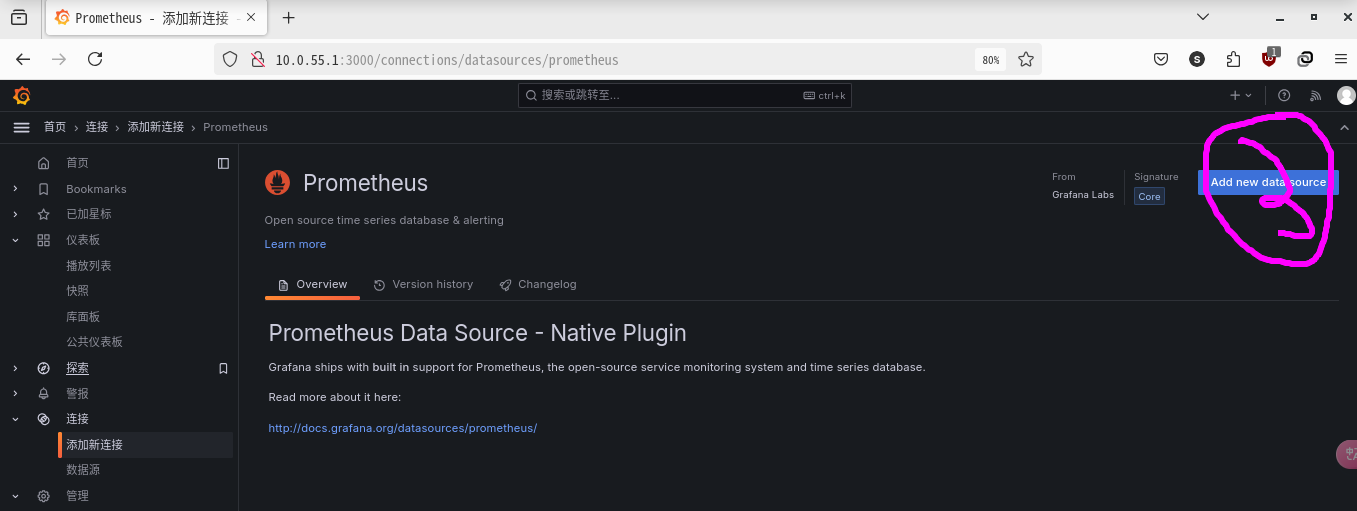
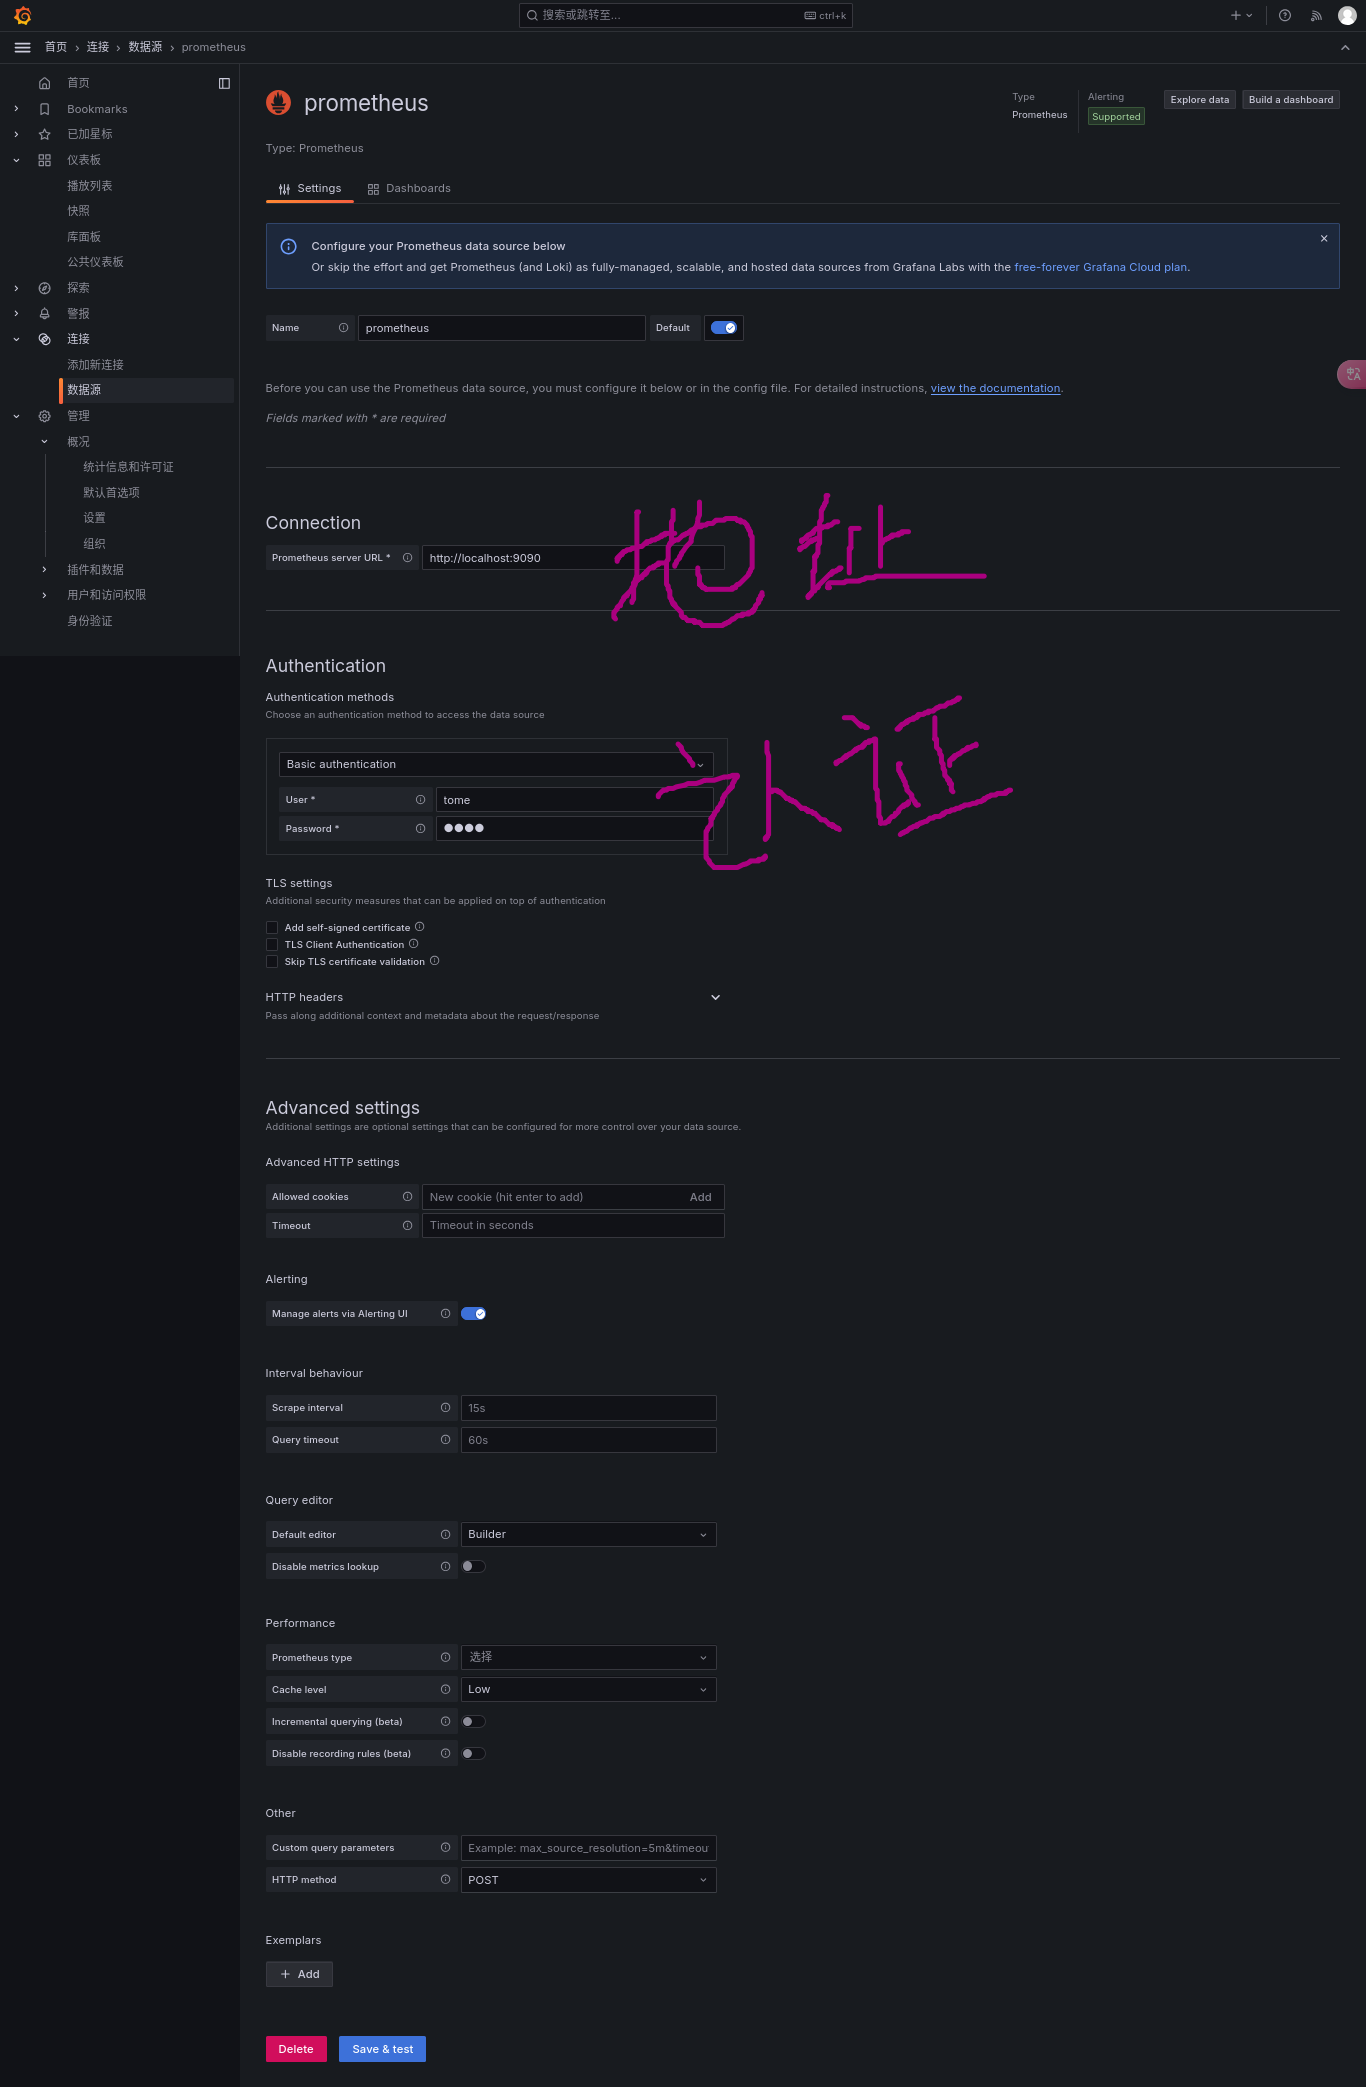
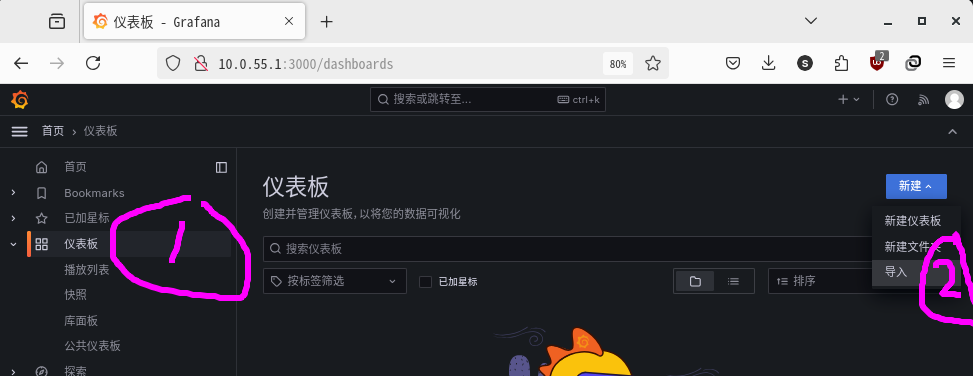
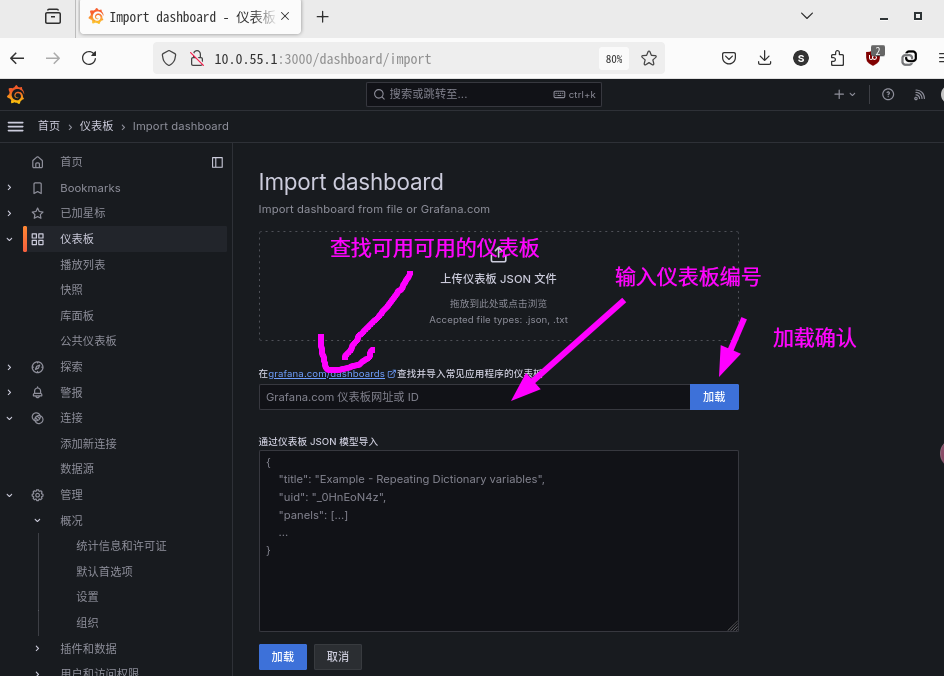
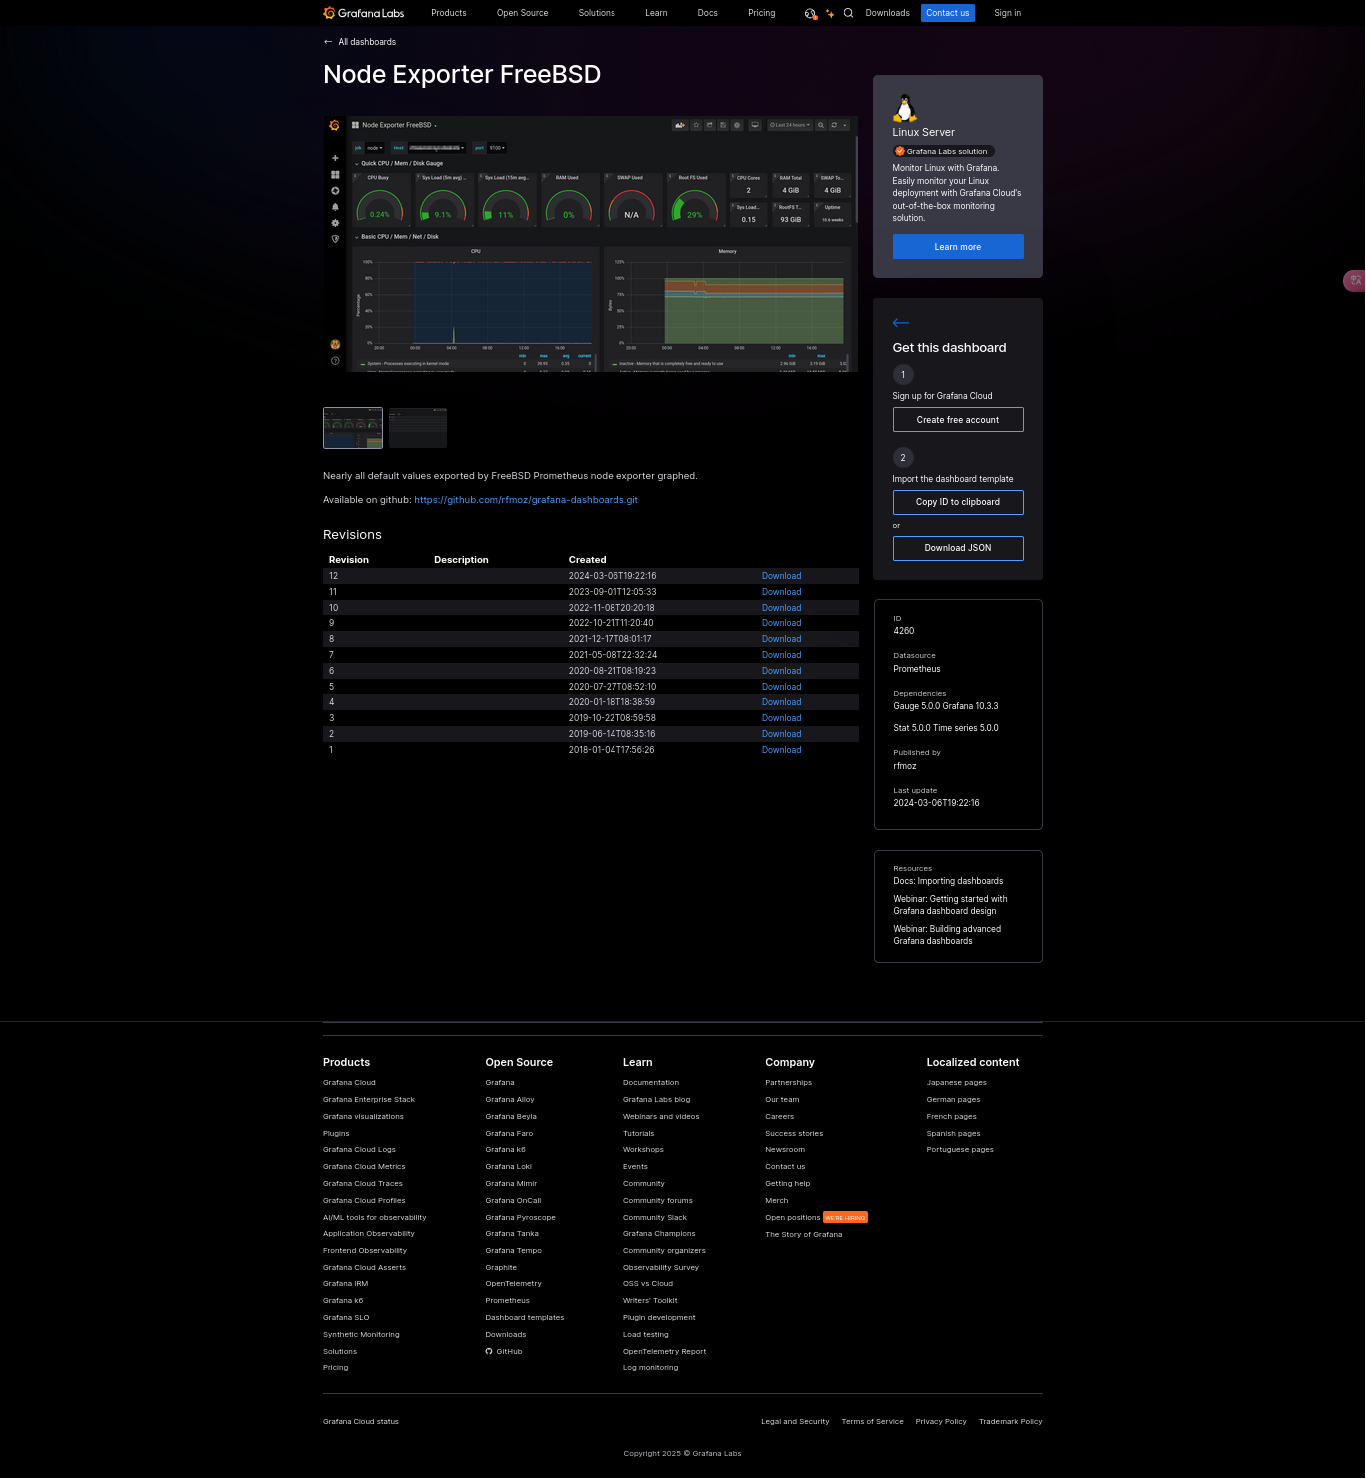
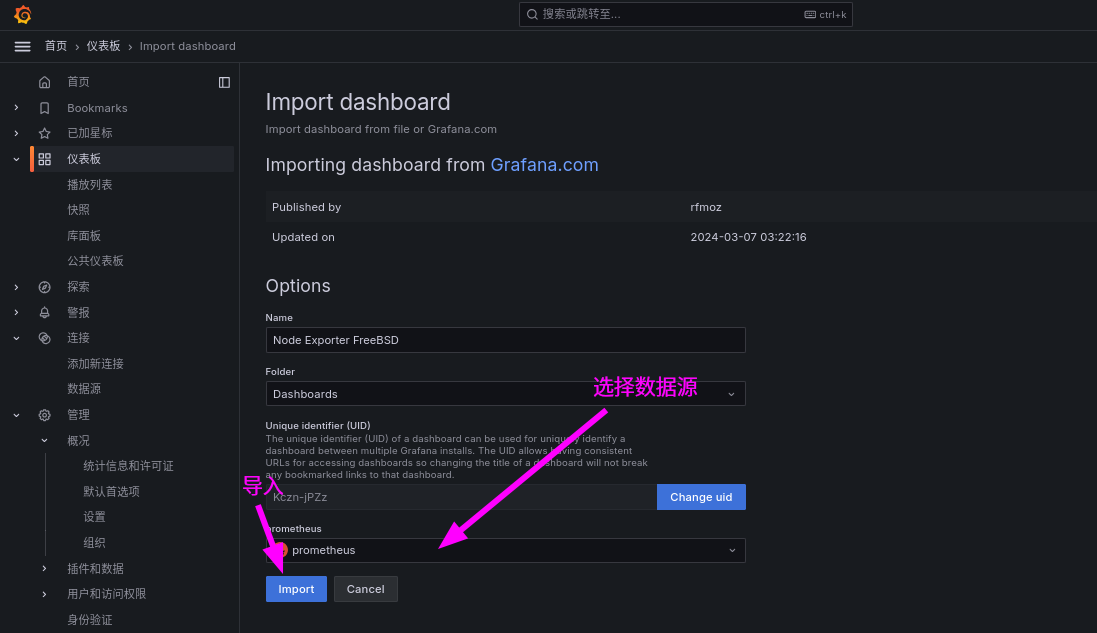
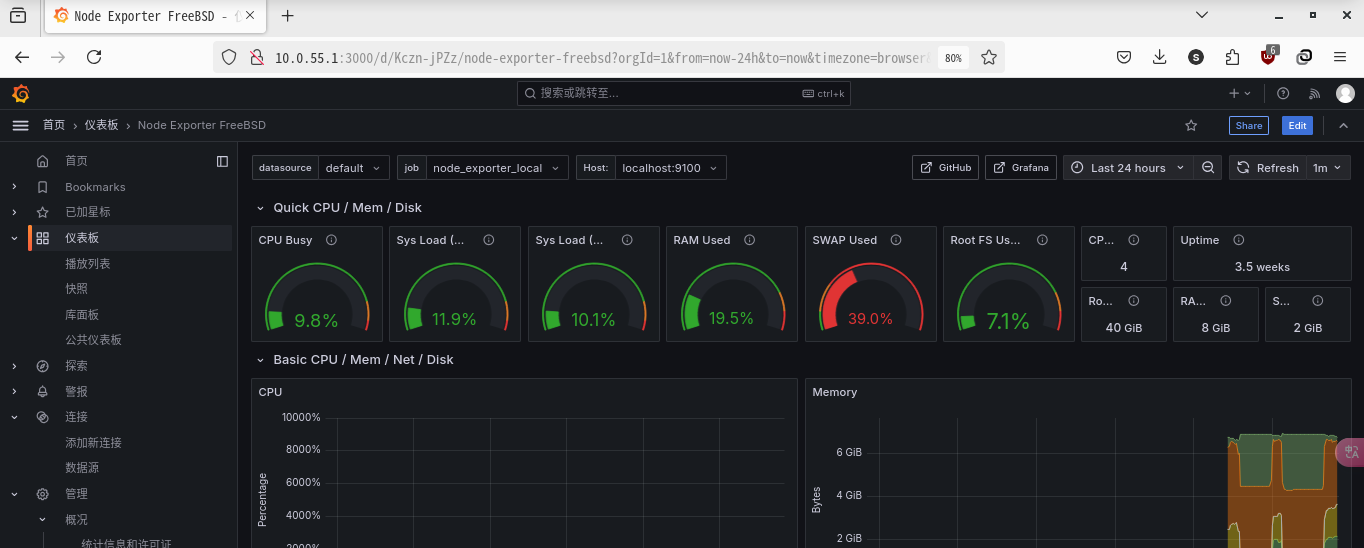
使用已创建的数据源创建仪表板,可导入社区预设模板。
25.2.4 安全认证
默认情况下,仅 Grafana 登录需要密码。各组件之间通过 HTTP 连接,例如可通过访问 http://ip:9100/ 直接获取 Node Exporter 的监控数据,Prometheus 可通过 http://ip:9090/ 直接访问。
生产环境中直接暴露这些信息存在安全风险,因此需完成安全认证。
25.2.4.1 基本认证
25.2.4.1.1 Prometheus 的 basic_auth
- 编辑 /usr/local/etc/prometheus_webconfig.yml 文件,格式如下:
basic_auth_users:
prometheususer: $2a$10$mxpc1PdYgOwvGepNtCuBKO6RXVUzLDg8feOvuz6szOsBa9M28ECfe第二行中,冒号前为用户名,冒号后为密码的 bcrypt 哈希值,此处使用 sttr 工具生成,也可使用其他工具。假设密码为 prometheuspassword:
# pkg install sttr
$ sttr bcrypt prometheuspassword
$2a$10$mxpc1PdYgOwvGepNtCuBKO6RXVUzLDg8feOvuz6szOsBa9M28ECfe%末尾的 % 是终端未换行时的显示符号,可忽略。
- 编辑 /usr/local/etc/prometheus.yml 文件,在 Prometheus 配置中加入下面三行:
    basic_auth:
      username: prometheususer
password: prometheuspassword请注意缩进,完整示例如下:
scrape_configs:
  # The job name is added as a label job=<job_name> to any timeseries scraped from this config.
  - job_name: "prometheus"

    # metrics_path defaults to '/metrics'
    # scheme defaults to 'http'.

    static_configs:
      - targets: ["localhost:9090"]
    basic_auth:
      username: prometheususer
      password: prometheuspassword

  - job_name: "node_exporter_local"
    static_configs:
- targets: ["localhost:9100"]- 修改 prometheus 启动配置,并重启
# sysrc prometheus_args="--web.config.file='/usr/local/etc/prometheus_webconfig.yml'"  # 设置 Prometheus 启动参数,指定 Web 配置文件
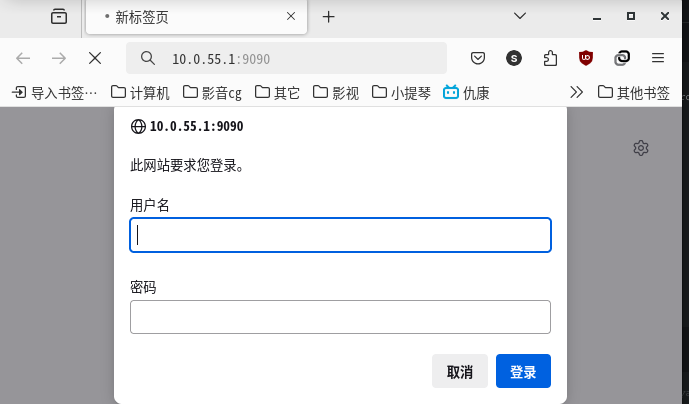
# service prometheus restart # 重启 Prometheus 服务以应用配置访问 http://ip:9090/ 时,Prometheus 会要求先登录:
Grafana 连接数据源时也需设置认证信息。
25.2.4.1.2 Exporter 的 basic_auth
下面以 node_exporter 为例:
- 编辑 /usr/local/etc/node_exporter_webconfig.yml 文件,格式如下:
basic_auth_users:
node_exporter_user: $2a$10$XoJoz.x.m9FTEbaTF3hBsehE9C8zCWjCQUHkSL0Isk53UnUTjR4hi- 修改 node_exporter 启动配置,并重启服务
# sysrc node_exporter_args="--web.config.file='/usr/local/etc/node_exporter_webconfig.yml'"
# service node_exporter restart- 编辑 /usr/local/etc/prometheus.yml 文件,如下:
scrape_configs:
  # The job name is added as a label job=<job_name> to any timeseries scraped from this config.
  - job_name: "prometheus"

    # metrics_path defaults to '/metrics'
    # scheme defaults to 'http'.

    static_configs:
      - targets: ["localhost:9090"]
    basic_auth:
      username: prometheususer
      password: prometheuspassword

  - job_name: "node_exporter_local"
    static_configs:
      - targets: ["localhost:9100"]
    basic_auth:
      username: node_exporter_user
password: node_exporter_password重启 Prometheus。
# service prometheus restart25.2.4.2 CA 证书认证
如果对安全要求较高,还可使用 CA 证书认证方式增强安全性,但这不是每个 exporter 都支持的认证方式。
以下仍以 Node Exporter 为例,假设其节点 IP 为 10.0.55.1。
25.2.4.2.1 生成证书
# 生成 CA 私钥
$ openssl genpkey -algorithm RSA -out ca.key
# 生成 CA 证书
$ openssl req -new -x509 -key ca.key -out ca.crt -days 3650 -subj "/CN=my-ca"25.2.4.2.2 生成 prometheus 端证书
# 生成 Prometheus 客户端私钥
$ openssl genpkey -algorithm RSA -out prometheus.key
# 生成客户端证书请求
$ openssl req -new -key prometheus.key -out prometheus.csr -subj "/CN=prometheus-client"
# 使用 CA 对客户端证书请求进行签名
$ openssl x509 -req -in prometheus.csr -CA ca.crt -CAkey ca.key -CAcreateserial -out prometheus.crt -days 365025.2.4.2.3 生成 node_exporter 端证书
- 创建一个 OpenSSL 配置文件,以便在生成证书时指定 SAN(Subject Alternative Name)。
创建文件并命名为 san.cnf,内容如下。
[ req ]
distinguished_name = req_distinguished_name
x509_extensions = v3_ca
prompt = no

[ req_distinguished_name ]
CN = node-exporter-server

[ v3_ca ]
# 添加 SAN 字段
subjectAltName = @alt_names

[ alt_names ]
DNS.1 = node-exporter-server.example.com  # 如果有域名,添加它
IP.1 = 10.0.55.1 # 如果用的是 IP 地址,添加它- 生成证书请求时使用 SAN 配置
使用这个配置文件以生成证书签名请求(CSR)和证书。
# 首先,生成私钥
$ openssl genpkey -algorithm RSA -out node_exporter.key
# 然后,生成带有 SAN 字段的 CSR。
$ openssl req -new -key node_exporter.key -out node_exporter.csr -config san.cnf
# 用 CA 签署证书
$ openssl x509 -req -in node_exporter.csr -CA ca.crt -CAkey ca.key -CAcreateserial -out node_exporter.crt -days 3650 -extensions v3_ca -extfile san.cnf必须指定 SAN(Subject Alternative Name),否则可能无法访问。也可以在 Prometheus 中配置忽略证书验证,但这与安全原则相悖,本文不予赘述。
25.2.4.2.4 配置 Prometheus 和 node_exporter
编辑 /usr/local/etc/node_exporter_webconfig.yml 文件,如下:
tls_server_config:
  cert_file: /path/to/node_exporter.crt
  key_file: /path/to/node_exporter.key
  client_ca_file: /path/to/ca.crt
client_auth_type: "RequireAndVerifyClientCert"最后一项配置最为重要,此选项是确保安全性的关键。
修改 /usr/local/etc/prometheus.yml 文件如下:
  - job_name: "node_exporter_local"
    static_configs:
      - targets: ["10.0.55.1:9100"]
    scheme: 'https'
    tls_config:
      cert_file: '/path/to/prometheus.crt'
      key_file: '/path/to/prometheus.key'
ca_file: '/path/to/ca.crt'这两个文件在 基本认证 中已经提及,用法相同。
密钥和证书文件的存放位置及权限应设为最低访问权限。
重启 Prometheus 和 node_exporter 即可。
25.2.5 Pushgateway
上述介绍均为 Pull 方式,由 Prometheus 从各个 Exporter 拉取数据;Pushgateway 则允许监测点主动推送数据到 Pushgateway,再由 Prometheus 从 Pushgateway 拉取数据,适合临时任务和批量任务的监控场景。
- 安装 pushgateway
# pkg install pushgateway
# service pushgateway enable
# service pushgateway start- 在 Prometheus 中配置 Pushgateway
编辑 /usr/local/etc/prometheus.yml 文件,增加如下内容:
  - job_name: "pushgateway"
    static_configs:
- targets: ["localhost:9091"]- 临时任务举例
假设有一个查看僵尸进程的管理脚本,如下:
num=$(ps aux |awk 'NR>1 {print $8}'|grep Z|wc -l)
echo "process_zombie $num"|curl --data-binary @- http://10.0.55.1:9091/metrics/job/check_processes第一行检查僵尸进程数量,第二行将僵尸进程计数发送到 Pushgateway。注意发送的数据每行必须以换行符 \n 结尾。
25.2.6 告警
Prometheus 的告警依赖 Alertmanager 组件。此处以 Jail Exporter 为例(安装配置较为简单,参见上文),同时需要在 /boot/loader.conf 文件中写入 kern.racct.enable=1 以开启系统记账功能。
- 使用 pkg 安装:
# pkg install alertmanager- 配置 Alertmanager 告警路由规则
以下示例仅展示 Email 通知方式,Alertmanager 也支持其他通知渠道。
global:
  smtp_smarthost: 'smtp.sina.com:25'
  smtp_from: 'xxxxx@sina.com'
  smtp_auth_username: 'xxxxx'
  smtp_auth_password: 'xxxxxxxxxxxxxxx'
templates:
  - '/usr/local/etc/alertmanager/template/*.tmpl'
route:
  group_by: ['alertname']
  group_wait: 30s
  group_interval: 5m
  repeat_interval: 3h
  receiver: xxxxx

  routes:
    - matchers:
        - alertname=~"jail"
      receiver: xxxxx
      routes:
        - matchers:
            - severity="critical"
          receiver: xxxxx

receivers:
  - name: 'xxxxx'
    email_configs:
- to: 'xxxxx@qq.com'其中 global 指定全局配置,此处指定了 SMTP 服务。route 指定发送路由规则。receivers 指定接收者信息。
- 配置告警规则
编写规则文件,如 /usr/local/etc/prometheus/alert.rules.yml 文件:
groups:
- name: jails-alerts
  rules:
  - alert: jail_down
    expr: absent(jail_id{name="dox"})
    for: 5m
    labels:
      severity: critical
    annotations:
      summary: "jail dox is down"
description: "jail dox is down"alert指定告警名称。expr指定告警触发条件表达式,这里使用absent(jail_id{name="dox"})表示 jail dox 的指标(jail_id)不存在时触发告警。for指定触发告警的等待时间,此处为 5 分钟。如果在 5 分钟内问题得到解决,则不会发送告警。
- 在 Prometheus 配置文件中引入规则文件,并连接 Alertmanager
# Alertmanager configuration
alerting:
  alertmanagers:
    - static_configs:
        - targets:
          - 10.0.55.1:9093

# Load rules once and periodically evaluate them according to the global 'evaluation_interval'.
rule_files:
  # - "first_rules.yml"
  # - "second_rules.yml"
- "/usr/local/etc/prometheus/alert.rules.yml"- 重启 Prometheus 和 Alertmanager
# service prometheus restart
# service alertmanager restart- 测试
关闭 Jail 以触发规则:
# jail -r dox5 分钟后发送告警邮件。
再开启 Jail。
# jail -c dox告警规则重置为非活跃状态。
25.2.7 远程存储
Prometheus 的数据支持远程存储。下面以 InfluxDB 为例。
- InfluxDB 的安装与配置可参考本书数据库相关章节。
InfluxDB 的服务名为 influxd。
为安全起见,应修改 /usr/local/etc/influxd.conf 文件,在 http 段开启 http 认证:
[http]
auth-enabled = true- 创建 InfluxDB 用户和数据库
使用 influx 命令进入命令行客户端
create database "prometheus"
create user prometheus with password '123'
grant read on prometheus to prometheus
grant write on prometheus to prometheus重启 InfluxDB 即可。
- 配置 Prometheus
编辑 /usr/local/etc/prometheus.yml 文件,修改如下:
remote_write:
  - url: "http://10.0.55.1:8086/api/v1/prom/write?db=prometheus&u=prometheus&p=123"
remote_read:
- url: "http://10.0.55.1:8086/api/v1/prom/read?db=prometheus&u=prometheus&p=123"FreeBSD Ports 中的 InfluxDB 为 v1 版本,使用 v1 API 配置。
重启 Prometheus 服务即可。
- 验证
可使用 influx 命令查询数据库中的数据指标:
use prometheus   -- 切换到 Prometheus 数据库
select * from jail_id   -- 查询 jail_id 表中的所有记录
1739497283285000000 jail_id  192.168.0.100:9452 jail_exporter prometheus 1
1739497298285000000 jail_id  192.168.0.100:9452 jail_exporter dox        4
1739497298285000000 jail_id  192.168.0.100:9452 jail_exporter prometheus 1
1739497313285000000 jail_id 192.168.0.100:9452 jail_exporter dox 425.2.8 Prometheus 深入配置
25.2.8.1 存储与数据管理
Prometheus 的数据存储在 /var/db/prometheus 目录。建议在 ZFS 上将其作为独立数据集并启用压缩:
# zfs create -o compression=zstd sys/var/db/prometheus25.2.8.2 配置文件详解
Prometheus 的配置文件 /usr/local/etc/prometheus.yml 采用 YAML 格式,需特别注意避免使用制表符,并使用适当空格缩进:
global:
  scrape_interval: 15s
  evaluation_interval: 15s

scrape_configs:
  - job_name: "prometheus"
    static_configs:
      - targets:
          - mistwood:9090
  - job_name: bdc
    static_configs:
      - targets:
- mistwood:910025.2.8.3 PromQL 查询语言
Prometheus 提供了查询语言 PromQL,可查询和分析监控数据。Grafana 可解析 PromQL 并基于其构建仪表板。用户还可使用 PromQL 编写自定义的临时查询,快速搜索,无需先构建仪表板。
25.2.8.4 导出器
导出器负责提取、格式化并发送指标。特定软件(如数据库)有多个对应的导出器可供选择。RabbitMQ、GitLab 和 Grafana 等应用程序支持将自身应用状态导出为 Prometheus 兼容的格式以供监控。
25.2.8.5 告警管理器
告警管理器是 Prometheus 的重要组件,可在特定事件发生时发送多种通知(电子邮件、短信、寻呼器、聊天消息)。可配置告警规则,在特定事件或阈值触发时发送通知(例如系统不可达或剩余磁盘空间仅 10%)。
25.2.9 参考文献
- Prometheus. Exporter 配置参考[EB/OL]. [2026-03-25]. https://github.com/prometheus/exporter-toolkit/blob/master/docs/web-configuration.md. 提供 Exporter 安全认证与 TLS 配置的完整说明。
- Prometheus. Prometheus 配置参考[EB/OL]. [2026-03-25]. https://github.com/prometheus/prometheus/blob/main/docs/configuration/configuration.md. 详述 Prometheus 主配置文件的完整参数集。
- Prometheus. 远程存储相关[EB/OL]. [2026-03-25]. https://prometheus.io/docs/operating/integrations/#remote-endpoints-and-storage. 介绍 Prometheus 远程读写接口及集成方案。
- Prometheus. Alertmanager 配置参考[EB/OL]. [2026-03-25]. https://prometheus.io/docs/alerting/latest/configuration/. 告警路由与通知渠道的完整配置指南。